
Page 91 - IJEEE-2022-Vol18-ISSUE-1
P. 91
Ali & Rashid | 87
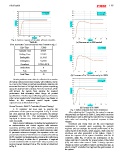
Fig. 6: System response of the plant without controller. (a) Decrease m2 to 250 kmole/h
TABLE 1
(b) Decrease m2 to 250 kmole and yi to 100%
STEP-RESPONSE CHARACTERISTICS FOR SYSTEM IN Fig. 5
(c) Increase yi to 100%
Rise Time 3.5862 Fig. 7: system response after some disturbance.
After adjusting the PI controller, the system's response
Transient Time 8.5391 characteristics are depicted in Table 2, along with its reaction
to disturbances such as altering the input feed m2 or opening
Settling Time 8.5149 valve value and recording the system's response to these
changes.
SettlingMin 33.5413 Overshoot and rising time are the most important
components to consider when examining the system's
SettlingMax 36.8369 response and can evaluate the overall performance of the
system based on the results, which suggest a high value for
Overshoot 3.7767e-05 % overshoot and other parameters in the system. Figure 9
shows the response of the system simulation with the PI
Undershoot 0 controller, while Fig. 10 shows the performance of the
system with the PI controller for several values of feed inlet
Peak 36.8369 (m2) and outlet valve control. Table 3 clearly expresses
changes in values especially overshoot and transient time, in
Peak Time 12 which using PI controller has improved the performance of
the system.
Certain problems occur often in refineries for a number
of reasons such as lower input supply, valve failures, and so
on. Due to this failure occurring immediately, reducing the
situational feed rate to 250 kg/h while the system is operating
causes the desired level to deviate from the real level, which
will prevent the system from meeting the required
performance that ultimately affect things all product
specifications. Another aspect affecting system performance
is the output control valve's precision; hence, any change or
failure in this component would impair system
responsiveness as illustrated in Fig. 7.
Second Scenario: With PI Controller (Manual Tuning)
A PI controller has been used to improve the
performance of the system as recognized in Fig. 8. A trial
and error approach will be used to determine the optimal
parameters for the PIs. This technique is frequently
employed in almost every industrial application, and it is
quite successful.
Due to several challenges, including the requirement for
an instrumentation and control engineer with extensive
experience working with online operating controllers and
knowledge of reading and observing system responses when
PI parameter values are changed, this operation in the real
process takes between 4 and 6 hours to complete after adding
the PI controller and simulating the system in the reallocation
(Basrah Refinery) to obtain the PI parameters. It required
several simulations with various P and I value to produce the
system response displayed below. The results are illustrated
in Fig. 9.