
Page 94 - IJEEE-2022-Vol18-ISSUE-1
P. 94
90 | Ali & Rashid
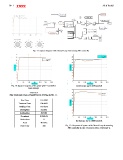
Fig. 11: System diagram with Closed-Loop Autotuning PID controller.
Fig. 12: System response of the plant with PI controller (a) Decrease m2 to 250 kmole/h
(auto tuning)
(b) Increase m2 to 1000 kmole/h.
TABLE 4 Fig. 13: Response of system with Closed-Loop Autotuning
STEP-RESPONSE CHARACTERISTICS FOR SYSTEM IN FIG. 11.
PID controller in case of several values of m2 and yi.
Rise Time 116.5438
Transient Time 194.4419
Settling Time 193.6038
36.0012
SettlingMin 40.3922
SettlingMax 0.9806 %
Overshoot
Undershoot 0
40.3922
Peak
Peak Time 388