
Page 93 - IJEEE-2022-Vol18-ISSUE-1
P. 93
Ali & Rashid | 89
(c) Increase yi to 100%. Third Scenario: PI Controller (Autotuning)
(d) Decrease yi to 0%. The PI Autotuner controller has been intended to
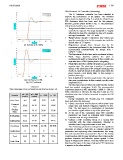
Fig. 10: Continued. improve the performance of the system. The modified
system has been depicted in Fig. 9, in which the Closed-Loop
TABLE 3 PID Autotuner block has been used for this purpose,
STEP-RESPONSE CHARACTERISTICS FOR SYSTEM IN FIG. 10. therefore, get the system shown in Fig. 11. The parameters
of this block should be set as follow:
Parameter m2 = 250 m2 = 1000 yi = 100% yi = 0% ? Target bandwidth: Determines how fast you want the
kmole/h kmole/h
1.03 controller to respond. The target bandwidth is roughly
Rise Time 4.9 1.42 3.57 35.49 2/desired rise time. For a desired rise time of 4 seconds,
35.49 set target bandwidth = 2/4 = 0.5 rad/s.
Transient 57.46 25.15 35.61 32.23 ? Target phase margin: Determines how robust you
Time 57.46 25.15 35.61 want the controller to be. In this example, start with the
default value of 75 degrees.
Settling ? Experiment sample time: Sample time for the
Time experiment performed by the Autotuner block. Use the
recommended 0.02/bandwidth for sample time =
SettlingMin 33.11 38.28 37.97 0.02/0.5 = 0.04s.
The Experiment tab has three main experiment settings:
SettlingMax 56.61 53.98 49.1 74.56 ? Plant Type: Specifies whether the plant is
asymptotically stable or integrating. In this example, the
Overshoot 38.98% 34.96% 22.5% 86.46% separator drum D5204 System plant is integrating.
? Plant Sign: Specifies whether the plant has a positive or
Undershoot 0 0 0 0 negative sign. The plant sign is positive if a positive
change in the plant input at the nominal operating point
Peak 56.61 53.98 49.1 74.56 results in a positive change in the plant output when the
plant reaches a new steady state. In this example a
Peak Time 29 16 24 16 positive plant sign.
? Sine Amplitudes: Specifies amplitudes of the injected
sine wave perturbations. In this example, specify a sine
amplitude of 0.3.
Start the experiment at 140 secs to ensure that the martial
level has reached steady-state H=40. The recommended
experiment duration is 200, bandwidth = 200/0.4 = 500 sec.
With a start time of 140 secs, the stop time is 640 sec. The
simulation stop time is further increased to capture the full
experiment.
During simulation, the Closed-Loop PID Autotuner
block performed the following:
1) Injects a test signal into the plant to collect plant input-
output data and estimate frequency response in real-
time. The test signal is a combination of sinusoidal
perturbation signals added on top of the plant input.
2) At the end of the experiment tunes PID controller
parameters are based on estimated plant frequency
responses near the target bandwidth.
3) Updates a PID Controller block or a custom PID
controller with the tuned parameters, allowing to
validate closed-loop performance in real-time.
The Autotuning parameters strategy has the significant
advantage of taking a short time to calculate optimal PI
parameters and improving other characteristics like rising
time and overshoot that are presented in Fig. 12. The testing
control system with the same disturbance that is taken in the
previous scenarios and behavior system against it clear
appear in Flappers and Tables 5. From the results can be seen
that the performance in the case of using the PID Autotuning
is superior to the other methods.