
Page 92 - IJEEE-2022-Vol18-ISSUE-1
P. 92
88 | Ali & Rashid
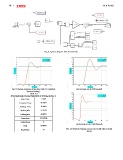
Fig. 8: System diagram with PI controller.
Fig. 9: System response of the plant with PI controller (a) Decrease m2 to 250 kmole/h
(manual tuning).
TABLE 2 (b) Increase m2 to 1000 kmole/h
Fig. 10: System response in case of several values of m2
STEP-RESPONSE CHARACTERISTICS OF SYSTEM IN Fig. 9
and yi.
Rise Time 3.5769
Transient Time 30.5807
Settling Time 30.5807
SettlingMin 37.9758
SettlingMax 49.0099
Overshoot 22.5402%
Undershoot 0
Peak 49.0099
Peak Time 19