
Page 54 - 2023-Vol19-Issue2
P. 54
50 | Hashim & Yassin
selected through the use of the proposed method (PC-MI) TABLE IV.
to be used by the proposed model (soft voting classifier) to Comparison between the performance of our work and
give the best classification fit of the tumour type, whether it is machine learning models used
benign or malignant.
Model Accuracy Precision Recall F1 Score
IV. RESULTS AND DISCUSSION
Logistic Regression (LR) (%) 0.9846 0.9846 0.9846
In this section, the performance results based on the pro- Decision Tree (DT) 98.6% 0.9412 0.9846 0.9624
posed methodology are shown and discussed in terms of the Support Vector 96.5%
F1 score, precision, recall, accuracy, AUC, and ROC curves. 0.9839 0.9385 0.9606
We conduct three experiments, where the first experiment Machine (SVM) 96.5%
includes comparing the performance of the soft voting classi- Soft VotingClassifier [LR, DT, SVM] 1 0.9846 0.9922
fier with the models included (LR, SVM and DT) separately. 99.3%
The second experiment includes displaying the results of the
soft voting classifier and comparing them with the previous Table IV shows that the soft voting classifier obtains the
work, as both experiments use train–test–split as a way to split highest degree of accuracy (99.3%), F1 score (0.9922), re-
the dataset. In the third experiment, the dataset is split into call (0.9846), and precision (1) because the voting classifier
10-fold, and the results of the performance of the soft voting depends on integrating the three models into one model that
classifier are presented. In addition, we explain the place of carries the strength of these combined models, which leads to
our proposed methodology and the contribution made to the the best prediction accuracy.
applied side of early diagnosis of breast cancer.
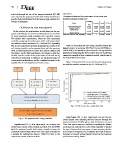
Figure 7 shows the ROC curves for the soft voting classi-
fier with the models included in it (LR, SVM and DT).
Fig. 7. ROC curves for models that used.
Fig. 6. The proposed soft voting classifier. Experiment (2): In this experiment, we use the bal-
anced dataset after selecting the best features through the
Experiment (1): In this experiment, we compare the proposed method PC-MI, where only 18 features are used.
performance results of the models used (LR, DT and SVM) Train–test–split is used as a method for splitting the dataset,
with the proposed model (soft voting classifier) using the as the data are entered into a soft voting classifier to predict
presented methodology, where train–test–split is adopted as the type of tumour that may appear in some persons, whether
a method for splitting the dataset. Table IV refers to the it is benign or malignant. Fig. 8 displays the result of the per-
comparison results of these models. formance of the soft voting classifier based on the important
performance scaling factors.