
Page 52 - 2023-Vol19-Issue2
P. 52
48 | Hashim & Yassin
combine first to obtain the highly interrelated features with TABLE II.
each other and know which of these features has the highest FEATURES DROPPED FROM THE DATASET
degree of correlation with the target class. We create a new
filter method that combines PC and MI. This method is called No Features No Features
feature selection based on PC and MI (PC-MI).
1 area worst 7 compactness mean
Firstly, this method finds the features that have a PC value
greater than or equal to 0.89 by analysing the correlation heat 2 radius worst 8 concavity mean
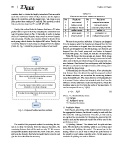
map of features shown in Fig. 4. Secondly, it works to merge
the set of interrelated features that contain common features 3 perimeter mean 9 concave points worst
into one group. Thirdly, one common feature is chosen from
each group, which obtains the highest MI value. Finally, the 4 radius mean 10 radius se
remaining features in each group are dropped from the dataset
(Table II). Fig. 5 shows the proposed method of our work. 5 area mean 11 perimeter se
6 texture mean 12 compactness worst
We note from previous table that 12 features are dropped
from the dataset, where five features are dropped from the first
group, one feature is dropped from the second group, three
features are dropped from the third group, two features are
dropped from the fourth group and one feature is dropped
from the fifth group. As a result, we have the 18 best features.
Table III shows that five groups are found. Each group
contains pairs of features that are strongly connected to each
other, and all these pairs that belong to one group have com-
mon features. One feature from each group with the highest
MI value is selected as the highest feature with a strong corre-
lation with the target class.
4) Normalizing the Selected Features: After selecting the
best features from the dataset through the proposed method
for feature selection, we normalise the remaining features
using StandardScaler. The main objective of StandardScaler
is to convert feature values into standard units free from the
influence of the arithmetic mean and dispersion, where the
resulting values are free from the units of measurement. It
can be computed from eq. 3 [22]:
Z = [X - X¯ ]/S (3)
where: • Z: StandardScaler Score
• X: Sample
• X¯ : Arithmetic mean
• S: Standard deviation
Fig. 5. Proposed feature selection method. C. Prediction Phase
After the pre-processing of the dataset and the selection of
The result of the proposed method for selecting the fea-
ture is to drop 12 features from the dataset; therefore, the the appropriate features, the dataset is ready to work with the
remaining features that will be used are only 18. We remove ML model for making predictions. Therefore, in this section,
unimportant features that hinder the work of the ML model we explain the mechanism for dividing the dataset, the ML
and keep the features that help the model learn correctly and models used and the proposed model that will be used in the
give the best classification accuracy. prediction process.
1) Splitting Dataset: The dataset will be split into two
parts. The first part is the training, which is a set of data used
in training and building the model. The second part is the
testing, which is a set of data in which the performance of
the model is tested using a specific scale. In this paper, two
methods of splitting are used as follows: