
Page 190 - 2023-Vol19-Issue2
P. 190
186 | Gaid & Ali
in Fig. 9 (where S11 ˜ -9.85). However, if a less stringent - 6
dB threshold is considered, the bandwidth at this frequency
band will appear.
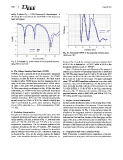
Fig. 10. Simulated VSWR of the proposed antenna using
HFSS and CST.
Fig. 9. Simulated S11 performance of the proposed antenna shown in Fig. 12 (c-f), the antenna’s maximum radiation level
using HFSS and CST. at 38.4 GHz is detected at - 41o/41o, while at 56GHz, the
maximum radiation occurs at -30o/30o.
B. The Voltage Standing Wave Ratio (VSWR)
VSWR is used to measure the level of impedance mismatch Figure 13 shows the gain and efficiency of the proposed
between the feeding system and the antenna. As VSWR antenna as a function of operating frequencies as predicted
increases, so does the level of mismatch. The ideal match by CST. The gain ranges from 7.54 dB to 7.6 dB in the 27.9
is achieved when VSWR has an absolute minimum value of GHz band, 5.4 dB to 6.4 dB in the 38.4 GHz band, and 7.6
unity. In this case, the simulation results show VSWR values dB to 8.25 dB in the 56 GHz band. The gains calculated
of 1.405, 1.281, and 1.099 at frequencies of 27.9, 38.4, and using CST and HFSS simulation software are very close, with
56 GHz, respectively, as displayed in Fig. 10 (the blue line). maximum values of 7.96 dBi (HFSS), 7.51 dBi (CST) at 27.9
Additionally, the VSWR for the three operational frequencies GHz, 6.82 dBi (HFSS), 6.03 dBi (CST) at 38.4 GHz, and
falls between 1 and 2, indicating that the antenna and the 7.93 dBi (HFSS), 8.17 dBi (CST) at 56 GHz, respectively.
feed line have excellent impedance matching and there are Moreover, Fig. 13 illustrates the radiation efficiency of the
minimal reflections. HFSS and CST simulations generally proposed antenna, which is 88%, 84%, and 90% at 27.9 GHz,
agreed, except for VSWR at 38.4 GHz, which is slightly less 38.4 GHz, and 56 GHz, respectively.
than 2 and matched S11 at the same resonance frequency
(S11 ˜ -9.85). Note that S11 = - 10 dB corresponds to VSWR D. Surface Current Distribution
˜ 1.922. Surface current distribution refers to the varying flow of elec-
tric current on the surface of an antenna. It is an important
C. Radiation characteristics characteristic that determines the radiation pattern and effi-
The gain of an antenna is an important performance factor that ciency of the antenna. In Fig. 14, the surface current dis-
represents its electrical efficiency and directivity. Our antenna tribution of the suggested antenna is displayed at resonant
design exhibits a 3D gain, as shown in Fig. 11, with maximum frequencies of 27.9 GHz, 38.4 GHz, and 56 GHz. The figure
values of 7.96 dBi, 6.82 dBi, and 7.93 dBi at the resonant indicates that the feed line, borders of the feed gaps, and the
frequencies, respectively. The 2D radiation patterns at the edges of the slots exhibit the highest current distribution. This
resonance frequencies for phi = 0o and phi = 90o, displayed information is significant as it provides insights into the per-
in Fig. 12, show good consistency between the simulated formance of the antenna and can be used to optimize its design
patterns obtained from HFSS and CST. It should be noted that, to achieve better efficiency and radiation characteristics.
as shown in Fig. 12 (a, b), the antenna radiates the highest
power in the broadside direction at 27.9 GHz. Moreover, as E. Comparison with Some Published Works
Table II provides a comprehensive comparison of the pro-
posed antenna in this paper with several recent publications.