
Page 117 - 2023-Vol19-Issue2
P. 117
113 | Al-Anbagi et al.
mismatch. Furthermore, selecting the right and suitable match-
ing method depends on several criteria. For instance, a simple
design with a minimum number of lumped elements is pre-
ferred because it is affordable to implement and introduces
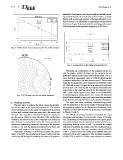
less losses. Figure 8 demonstrates the matching performance
of the transistor at the operation frequency of 435 MHz.
Fig. 6. Rollet factor versus frequency for the stable transisor
Fig. 8. S-parameters of the stable unmatched LNA
Fig. 7. SCIR polar plot for the stable transistor Observing the performance of the transistor in the S11
and S22 graphs, neither the input nor the output ports are
C. Matching networks perfectly matched to the source and load terminals. The S11
The next step is to evaluate the losses caused by the reflec- curve indicated a magnitude value of -0.22 dB which implies
a complete reflection of the input power at port 1. On the other
tion of the power at the input and output ports. The amount hand, the S22 parameter curve showed a low reflection value
of the reflected power at the input and output ports is relevant of -19.92 dB at port 2. Despite the low value of the reflected
to how well-matched these two ports are to the source and power at port 2, the resulting flat S22 response also inspires the
the load. The impedance mismatch between the input port importance of the matching network for this transistor since
and the source results in more reflection of the input power. such a wide band response may cause more vulnerability
Similarly, the return losses at the output port are increased to electromagnetic interferences. As a result, the transistor
when that port is mismatched to the load. Consequently, the should be terminated to input and output matching networks
impedance mismatching causes the efficiency of the amplifier to provide the aimed performance at the specified frequency.
to reduce. S11 and S22 parameters indicate how these two
ports are well-matched to the source and the load. The input and output matching networks design starts
with the evaluation of the current values of the input and out-
Impedance matching is crucial to improve the perfor- put impedance values from the Normalized Frequency Circle
mance of an LNA by maximizing the power transfer and min- Impedance Ratio (NFCIR) and S22 polar plots, as presented
imizing the NF through diminishing the losses of impedance in Figures 9 and 10.
The NFCIR plot helps visualize and analyze the input
impedance characteristics of a circuit over a range of frequen-
cies. By plotting the normalized impedance on a polar graph,
it provides insights into the impedance variation and the cor-
responding stability of the circuit. To evaluate the output
impedance matching, the output reflection coefficient S22 is
used in its polar form. The input impedance from the NFCIR
1.805 + 2.660i is taken into Smith chart software after nor-
malized to 50 ? and conjugated. The resulting impedance
of (90-133i) is used in a Smith chart software to evaluate