
Page 116 - 2023-Vol19-Issue2
P. 116
112 | Al-Anbagi et al.
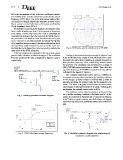
?S is the determinant of the reflection coefficients matrix. Fig. 4. SCIR polar plot for stability test at 435 MHz
The stability of the transistor should be examined at the aimed
frequency of 435 MHz. The AWR Microwave studio offers Looking at the simulated results presented in Figures 3 and
two metrics to identify whether the transistor is stable or not. 4, the Rollet factor has a value of 0.05, while the SCIR curve
These metrics are the Rollet factor (K factor) and Stability lies inside the unity circle, implying an unstable transistor at
Circle Impedance Ratio (SCIR). this operation frequency. Thus, a stabilizing method should
be involved. The simulation was performed on a range of
In the Rollet factor linear plot diagram, the transistor must (400-470) MHz with a resolution of 1 MHz. Thus, the LNA
have a value slightly more than 1 at the operation frequency operation frequency of 435 MHz is located at the step (36) as
to be stable. On the other hand, the SCIR is calculated by indicated in the legend of Figure 4.
measuring the distance from the center of the Smith chart to
the point where the stability circle intersects the unity gain One common method that can be used as a stabilizer is
circle. The SCIR is a useful parameter to evaluate the stability to connect a series or shunt resistor to the transistor collector.
of an amplifier design because it provides information about In this design, a shunt resistor is utilized with a slider to
the impedance match between the source and the load. For precisely determine the required value for the transistor to be
the transistor to be stable, the curve line must be outside the stable. The slider is slightly increased and decreased while
unity circle in the SCIR polar plot. observing the Rollet factor and the SCIR plots. Following this
mechanism, the optimal resistor value is 60 ?.
After terminating the transistor to the input and output
port in AWR Software, as shown in Figure 2 The evaluated The stabilizer resistor shunt termination is shown in Fig-
K factor and the SCIR were as depicted in Figures 3 and 4, ure 5 and the resulting modified Rollet factor and SCIR dia-
respectively. grams are presented in Figures6 and 7, respectively. Figures
6 and 7 show a stable transistor with Rollet factor of slightly
Fig. 2. Initially generated schematic diagram more than one and a curve outside the unity circle in the SCIR
plot.
Fig. 3. LNA Rollet factor versus frequency Fig. 5. Modified schematic diagram after terminating the
transistor to a shunt stablizer