
Page 156 - 2023-Vol19-Issue2
P. 156
152 | Mohammed, Oraibi & Hussain
V. RESULTS AND COMPARISON
A. Results
The performance evaluation is illustrated in the formula bel-
low:
Numbero fCorrectPredictions (1)
Accuracy =
TotalNumbero f Predictions
T ruePosit ives (2)
Precision =
TruePostives + FalsePositives
Recall = T ruePosit ives (3)
TruePostives + FalseNegatives
2 * (precision * Recall) (4)
F1Score = (Precision + Recall)
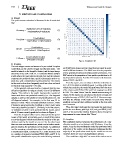
Fig. 4. Xception CM
1) Xception
The code snippet creates an instance of a pre-trained Xception on 20 different classes and the classification report is gener-
model that can be used for image classification tasks. The ated for 800 test instances. The PREC metric is the proportion
model is trained on the ImageNet dataset, and the input image of true positive predictions to total positive predictions. The
should be of size 224 × 224 × 3. A Confusion Matrix (CM) is REC metric is the proportion of true positive predictions to all
a table where the rows indicate the real class and the columns actual positive instances. And the F1-S metric is the harmonic
represent the predicted class, and it is frequently used to ex- mean of PREC and REC.
plain how well a classification system performs. The entries
in the matrix show how frequently each true class and each From the report, one can observe that the model has an
anticipated class appeared in the data. ACC of 0.93, which is relatively good. Looking at the indi-
vidual class statistics, the model has performed well for most
In this specific confusion matrix, it appears that the clas- of the classes with PREC, REC and F1-S ranging from 0.83
sification algorithm is trying to classify a set of 20 different to 1.00. The class ’Horse’ has the lowest scores among all
classes. The entries in the matrix represent the number of classes. In this report, one can also see the macro-average and
times each class was predicted correctly (i.e. the diagonal weighted-average of PREC, REC and F1-S. Macro-average
values) as well as the number of misclassifications (i.e. the will take the average of the metric for each class, whereas
off-diagonal values). For example, in the first row, 35 in- weighted-average will give additional weight to the class with
stances of class 1 were correctly classified as class 1, while more instances.
2 instances were incorrectly classified as class 6 and 2 were
incorrectly classified as class 11. Similarly, in the first column, Thus, this report indicates that the model has performed
37 instances of class 1 were predicted by the model, out of well on the test dataset, with high ACC and good PREC, REC
which 35 were correctly predicted as shown in Figure 4. and F1-S for most of the classes. However, there is scope for
improvement in some classes like ’Horse’.
From the Xception CM, it can be observed that the perfor-
mance of the model is relatively good, as most of the entries 2) Inception
are on the diagonal which means that the majority of the pre- This confusion matrix represents the performance of a clas-
dictions made by the model are correct. On the other hand, sification model on a test dataset with 20 classes. From the
there are some misclassifications, which can be further investi- matrix, it can be observed that the model has performed well,
gated to improve the performance of the model. An additional with most of the entries on the diagonal, indicating that the
tool for assessing a classification algorithm’s performance is majority of the predictions made by the model are correct.
a classification report. It covers the ACC of the model as well However, there are some misclassifications present.
as a number of measures including PREC, REC, and F1-S. In
this specific classification report, the model is being evaluated The model has a high ACC as most of the entries are on