
Page 27 - IJEEE-2022-Vol18-ISSUE-1
P. 27
Atiyah & Ali | 23
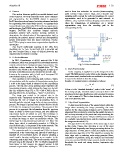
A. Dataset used in these five networks. An encoder (down-sampling
path) extracts image context maps, and a decoder (up-
This section discusses publicly accessible datasets used sampling path) extends the collected mappings for a pixel
in this research. For fully automated brain lesion detection segmentation mask to be generated in each network. In
and segmentation, the BraTS2020 dataset is proposed. addition, every network features skipping connections that
BraTS has always been focused on testing advanced methods allow the transmission of information via a precise
for segmenting MRI-based brain tumors. To separate brain segmentation map from the encoding path to the
tumors like gliomas, inherently different forms, appearances, corresponding levels.
and histologies, BraTS2020 relies on multi-institutional MRI
imagers. BraTS'20 also combines integral radiomic Fig. 3: U-Net Architecture
properties analysis with machine learning methods to
demonstrate the clinical value of this segmentation task by C. Data Preprocessing
predicting the patient's general survival and distinguishing
pseudo development from true tumor recurrence. Finally, Center cropping is applied to crop the images from the
BraTS'20 is trying to assess tumor segmentation algorithmic center. The MRI intensity value relies on the imaging system
uncertainty. and scanner used, standard scaler normalization is employed
to remove the distortion from the image.
Any BraTS multimodal scanning in the nifty form Sample ??’s standard score is calculated as follows:
describing the T1, T1ce, T2, and T2-FLAIR is provided and
has been acquired from a range of clinical protocols and ?? = (??-??) (1)
organizations involved in scanning.
??
B. U-Net Architecture
Where ?? is the ‘standard deviation’, and ?? is the ‘mean’ of
In 2015, Ronneberger et al.[11] projected the U-Net
architecture, which was among the first convoluted networks the training sample. Standard scaler's concept is that it will
created exclusively for biological-image interpretation. The
model has a shape similar to the English letter "U." The transform the data into distribution with a standard deviation
encoder is also known as the contracting path, is made up of
the basic convolutional process, whereas the decoder, also of 1 and a mean of 0. This is done feature-by-feature in the
known as the expansive path, is built up of transposed 2D
convolutional layers, as seen Fig. 3. case of multivariate data.
Each operation in the contracting path contains 2 layers D. Edge Based Segmentation
of convolution, with the number of channels increasing from
1 to 64 as the image depth is enhanced via the convolution To determine the borders of the wanted object within the
process. The red color arrow pointing down represents the image when accessing the image processing, the main
max-pooling process, which reduces the image size by half purpose for the edge sensing technique can be defined. The
(the size reduction from 572 × 572 ? 568 × 568 is due to edge algorithms are done by assessing the sudden increase or
padding difficulties, but padding = “same” is used here). fall in every intensity of the pixels and only visualizing the
sudden changes in the pixels. This pixel difference is crossed
The image was resized to its original size in the by a suitable convolution mask, and the resulting edges of
expansive path. Transposed convolution is a technique for the image are described [12].
increasing the size of images by up-sampling them. It
basically pads the original image before doing a convolution The approach for the detection of the canny edge is used
process. The image is upsized from 28×28×1024 to 56×56 in this study. Canny edge detection is one of the most
×512 after the transposed convolution. The purpose of this impactful and frequently used image processing devices for
process is to aggregate the information from the previous edge detection. In 1986, John F. Canny developed the canny
layers to obtain a more exact forecast, and two additional edge detection algorithm [13]. This algorithm contains the
convolution layers are added as well. This technique is basic steps such as reducing noise using gaussian filters,
recurrent three times more, as previously. The final stage is calculation of gradients along the vertical and horizontal
to reform the image to meet our prediction criteria. The axes, non-maximal falsified edge removal, double seclusion
former layer is a convolution layer with one 1×1 filter. The thresholds for weak and strong borders, hysteresis edge
dense layer, which is particularly prevalent in CNNs for tracking.
classification tasks, is not present in the entire network. The
rest of the training for neural networks is the same.
The expansion path in a conventional U-Net is almost
symmetrical to the contracting path. Instead of employing a
standard set of convolution layers, we propose adopting a
novel transfer learning architecture as an encoder in the
contracting path in this work. The decoder module works in
the same way as the original U-Net. To reliably separate the
brain tumor in MR images, we suggest various U-Net
semantic segmentation topologies. The U-Net structure is