
Page 124 - IJEEE-2022-Vol18-ISSUE-1
P. 124
120 | Jasim & Jasim
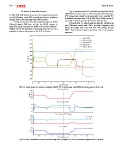
IV. RESULTS AND DISCUSSION Fig.16 shows how the PV irradiation drops from 500 to
100 W/m2 over time (1 sec.). This causes the solar PV power
A. The first case study shows how the adopted grid works (PV voltage and current) to decrease after 1 sec. until the PV
in grid-following mode (PQ control) and how an irradiance irradiation increases from 100 to 900 W/m2 at time point (3
change affects the solar plant and BESS system. seconds), at which point the PV power will increase.
In Fig.15 and at 2 sec. the reactive power of BESS From the Fig. 17, which indicates that the M-grid is in
(Qbess) towards 400 kvar so that the BESS operate in grid following mode with 50Hz tracking frequency and
capacitive mode. Because the BESS active power (Pbess)=- phase shift angle near zero with PCC rms voltage around
500kW, the BESS functions in charging mode at 4 sec. It is 600V. Fig.18 shows balance operation with zero negative
possible to observe the power of the PCC in brown. sequence.
Fig.15: Load, point of common coupling, BESS, PV active power and BESS reactive power in first case
Fig.16: Solar irradiation, boost converter duty ratio, voltages of PV and converter output and PV current.