
Page 144 - IJEEE-2022-Vol18-ISSUE-1
P. 144
140 | Atiyah & Thalij
Unit (ICU) or wouldn't require one. also comparing the eXtreme-Gradient Boosting (XGBoost), and K-Nearest
performance of algorithms in false-positive and false- Neighbors (KNN).
negative mislabeling, to select the best ones in accuracy and
speed of prognosis to aid the doctors in recognizing the Preparation of dataset
COVID-19 and avoid the mistake.
Pre-processing of dataset
II. RELATED WORK
Scaling of Feature Analysis of data
COVID-19 is related to the fast evolution of data basics, so
there is a need to analyze the relations and hierarchy of the data splitting
data utilizing the ML algorithms to aid the health system in
the diagnosis of COVID-19, [6].This paper provides recent Algorithms of classification
studies analysis of this area:
Sarwar et al. [7], diagnose diabetes using the algorithms of Performance Measurement
machine learning, the outcome referred to assured accuracy
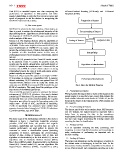
of 98.60%. These can be helpful to forecast COVID-19, the Fig.1. Show the Method Diagram
exact identification of COVID-19 can rescue many the
people, the output enormous of data to train algorithms. ML A. Preparation of Dataset
is possible to offer beneficial entries in this area, of We have gotten the dataset from a search of the dataset in the
performing prognoses based on Images, radiography, clinical google engine is a repository open_source that contains the
text, etc. most suitable information and details of COVID-19, the file
Iweendi et al. [8], presented a Fine-Tuned RF model, as well format is the dataset of xlxl which involve 1925 columns and
as the adaboost model. To predict the possible result, the 231 rows[13].
system uses the spatial, demographic, and health details of
COVID-19 patients, the results were an F1-Score of 0.86, an B. Pre-processing of Dataset
accuracy rate is 94%. A review of data refers to a strong The dataset used in this work contains about 1925 instances
relationship between the state of death and patient gender, and 231 features, the dataset should be improved with a
patient majority are among 20-70 ages. better form to process the data to the consistency
Bayat et al. [9], presented the system to anticipate COVID- requirements, before implementing the model. preprocessing
19 depending on testing in a standardized lab. A massive has two main stages: processing the missing values and
dataset containing 75,991 infections was gained from US encoding the data for classification.
Veterans-Affairs, utilized XGB to create the model, the
outcomes were 86.4% of accuracy, 86.8% of specificity, and C. Analysis of Data
82.4% of sensitivity. This work found the privileges of the It is an operation modeling the data, examining, and
top (10) are of downward significance. imagining to extract helpful information and knowledge to
Zhou et al. [10], presented a system to anticipate the disease make conclusions of performing an important role in
seriousness of COVID-19 infections. they used a dataset decision-making.
containing 377 infections (172 are seriousness, 106 are non-
seriousness) from one of the china's-hospitals, the Logistic D. Scaling of Feature
Regression was utilized to create the forecasting system, the The large-scale dimensions and the discrepancy of entries in
results were 87.9% of AUC, and 88.6% of sensitivity, the dataset make it challenging to find the data. So the
73.7% of specificity The outcomes were existed three dimensions of values should be compatible in the dataset to
separate elements linked strongly to COVID-19 infections: get an efficient model and computation speeding up in the
C_reactive proteins, age, and d-dime.
III. METHODOLOGY
The main stage of the methodology utilized in this study is
displayed in figure 1. Specificity, sensitivity, accuracy,
precision, ROC_AUC_Score, the positive and negative
prevalence, mislabeling and execution time are used to
measure performance. we used python to process the
outcomes to create a classification system (including
preparation of dataset, performing the pre-processing,
analysis of data, scaling of features, split of data, and
algorithm of classification), in the first model [11], we use
algorithms such as Stochastic Gradient Descent (SGD),
Naïve-Bayes (BN), Logistic-Regression (LR), and Random
Forest (RF). Second model [12], we use algorithms like
Support-Vector Machines (SVM), Decision-Tree (DT),