
Page 31 - 2023-Vol19-Issue2
P. 31
27 | Andreswari & Syahputra
Fig. 1. Fishbone Diagram of Lecturer Grading
IV. RESULTS AND DISCUSSION
A. Class Distribution
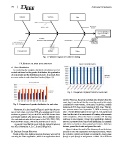
In conducting the analysis, statistical calculations are first
carried out based on the gender distribution, the graduation
of each gender and the distribution of grade. In general, there
are more males in each class than females (Figure 2).
Fig. 3. Comparison of passed-failed for each class
Fig. 2. Comparison of gender distribution for each class oped by Fluxicon. Based on statistical data obtained from the
event log, it was found that the event log used in this study
Moreover, it is also found in Figure 3 and 4 that the aver- consisted of 118039 events, 1670 cases, 9 activities, median
age of each class, more than 90% who graduate with female duration of 27.3 days, mean duration of 26.4 days. This lec-
students in general. Only in the 4201 and 4208 classes there ture process starts from September 7, 2020 to January 10,
are female students who did not pass, this is different from 2021. For the determination of one case ID, it is carried out
the male students who did not pass in the 4203, 4204, 4205, based on the start of an assessment of learning achievements
4206 and 4207 classes. While the distribution of values until completion, where this lecture consists of 5 learning
outcomes in one semester. Using Disco applications, business
in general found that the score with the highest frequency process is generated based on several dimensions, for example
was AB, followed by A, B, C, D and E (Figure 5). each lecturer, based on class, passed per lecturer, failed per
lecturer, passed for female and passed for male.
B. Business Process Discovery
Based on this data, business process discovery was carried Figure 6 shows the result of the discovery from the lecture
process on the web application development course, where
out using the Disco application, which is an application devel- the activities carried out include accessing the course page
(loop) ? quiz (loop) ? assignment ? label. On a different